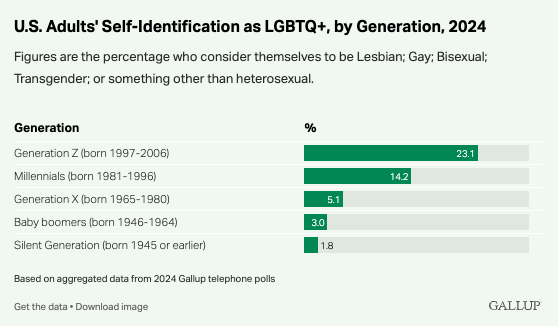
(ZENIT News / Washington, 03.02.2025).- The latest Gallup survey reveals that in 2024, 9.3% of U.S. adults identify as lesbian, gay, bisexual, transgender, or something other than heterosexual. This figure marks a steady increase from previous years, reflecting shifting generational trends in sexual orientation and gender identity. Compared to 2023, LGBTQ+ identification has risen by more than a percentage point, nearly doubling since 2020. When Gallup first measured this statistic in 2012, the figure stood at just 3.5%.

One of the most significant factors behind this rise is the growing openness among younger generations. More than one in five Generation Z adults (ages 18-27) identify as LGBTQ+, making them the most likely demographic to do so. Millennials follow with a rate of 12%, while older generations, including Gen X, Baby Boomers, and the Silent Generation, show progressively lower identification rates, with only 1.8% of the oldest Americans (born before 1946) identifying as LGBTQ+.
The Bisexual Majority and Generational Shifts
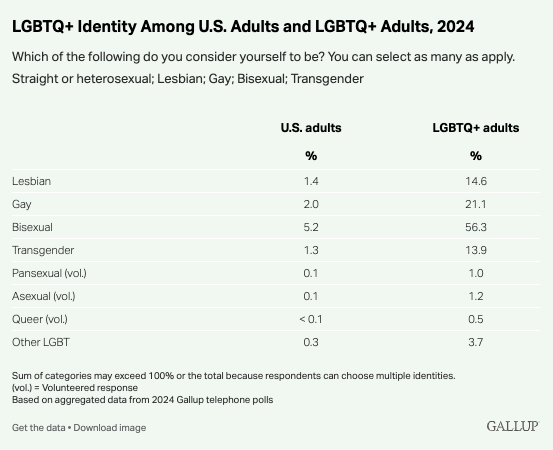
The most commonly reported LGBTQ+ identity is bisexual, a trend especially pronounced among younger adults. More than half (56%) of those identifying as LGBTQ+ describe themselves as bisexual, with the percentage even higher among Gen Z (59%) and Millennials (52%). This figure drops among Gen X (44%) and is significantly lower for Baby Boomers (19%) and the Silent Generation (11%), who are more likely to identify as gay or lesbian.
Gallup’s data, collected from interviews with over 14,000 adults, shows that 85.7% of respondents identify as heterosexual, 5.2% as bisexual, 2.0% as gay, 1.4% as lesbian, and 1.3% as transgender. Just under 1% chose other identities such as pansexual, asexual, or queer. Notably, 5% declined to answer.
While LGBTQ+ identification has surged among younger generations, the increase has been more modest for older groups. Millennials saw a nearly two-point rise in LGBTQ+ identity (from 10.3% to 12%) over the past few years, while Gen X experienced a one-point increase (from 3.8% to 4.8%). However, no significant shifts were observed among Baby Boomers or the Silent Generation.
Identity Trends by Gender, Politics, and Geography
Beyond generational differences, LGBTQ+ identification varies across gender, political ideology, and geography.
– Women are more likely than men to identify as LGBTQ+ (10% vs. 6%), a gap largely driven by bisexuality. Among Gen Z, 31% of women identify as LGBTQ+ compared to 12% of men. Among Millennials, the split is 18% vs. 9%.
– Political ideology plays a role, with 21% of liberals identifying as LGBTQ+, compared to 8% of moderates and just 3% of conservatives. Party affiliation follows a similar trend: 14% of Democrats, 11% of independents, and only 3% of Republicans identify as LGBTQ+.
– Urban areas see higher rates of LGBTQ+ identification (11%) than suburban (10%) or rural areas (7%).
– College education appears to have little impact, with similar identification rates among graduates (9%) and non-graduates (10%).
Other demographic patterns reflect broader age trends. For example, lower-income individuals, unmarried adults, non-religious people, and racial minorities—groups that tend to skew younger—also report higher LGBTQ+ identification rates.
A Continuing Trend of Growth
Over the past 12 years, LGBTQ+ identification in the U.S. has nearly tripled, driven by generational turnover and increasing societal acceptance. Young adults today are significantly more likely than older generations to openly identify as LGBTQ+, particularly as bisexual. However, identification across other categories—lesbian, gay, transgender, and non-binary—has also increased.
Thank you for reading our content. If you would like to receive ZENIT’s daily e-mail news, you can subscribe for free through this link.